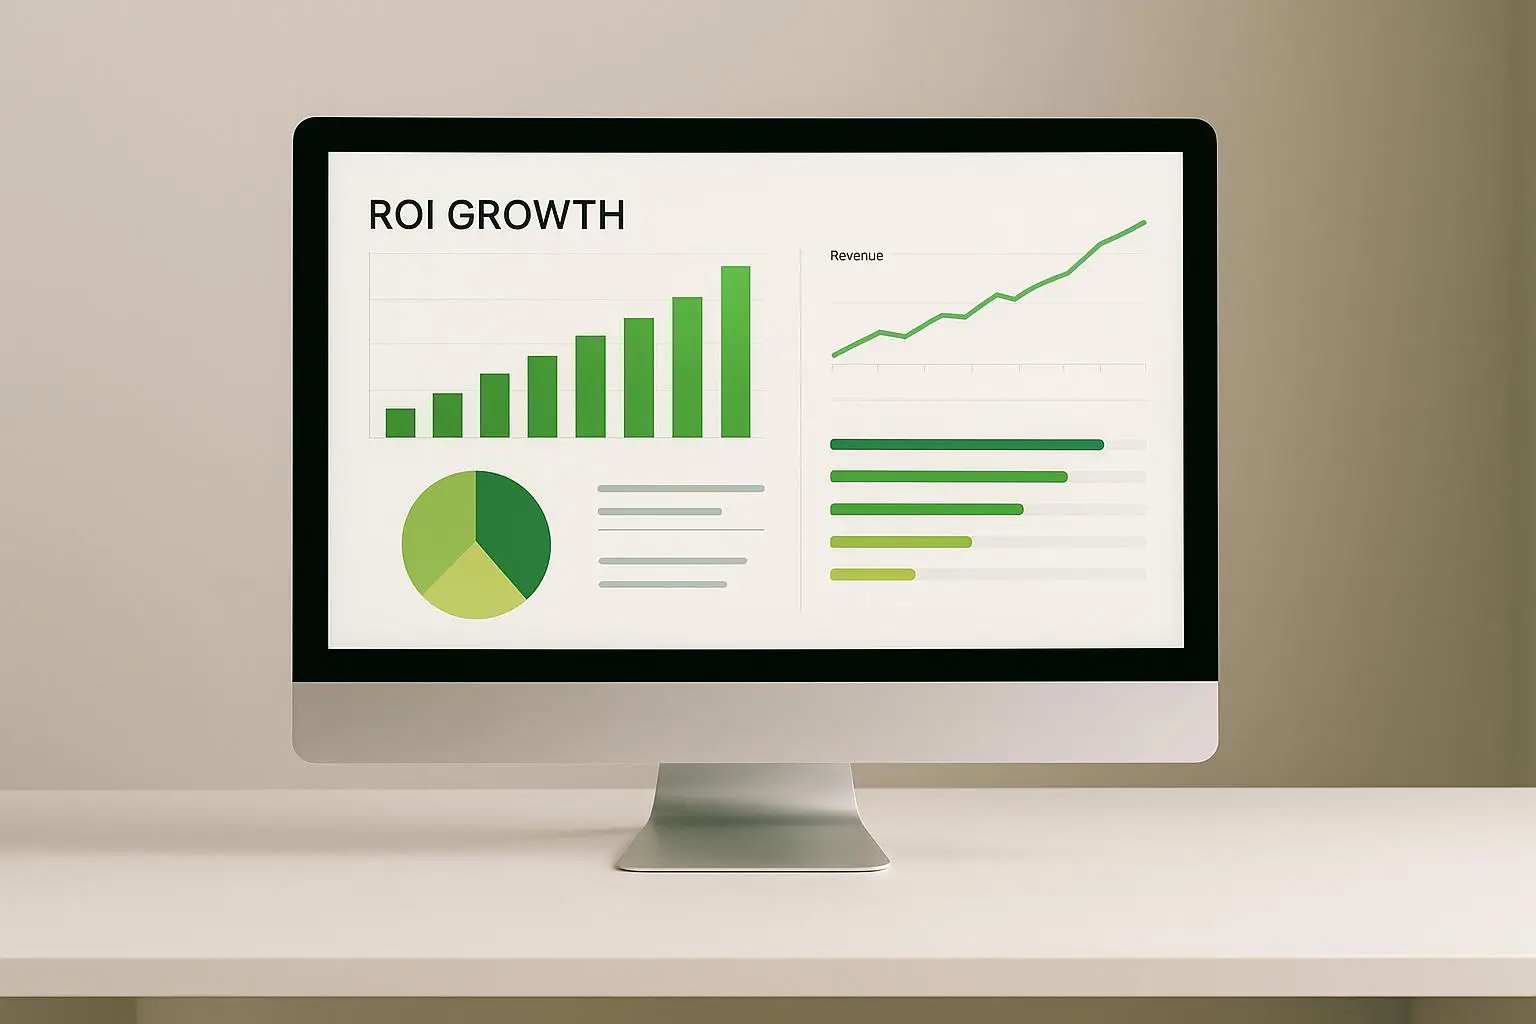
Big data analytics helps businesses measure and grow ROI by providing actionable insights from diverse customer data. Here’s how it works:
- Eliminates Guesswork: Combines customer behavior and purchase data to identify what drives conversions and cuts waste.
- Boosts ROI: Companies using analytics report up to 15–20% ROI growth. For example, an insurance company increased ROI by 15% in 4 years without raising its budget.
- Personalization & Forecasting: Predictive analysis enables hyper-targeted campaigns, increasing conversions and customer retention.
- Real-Time Adjustments: Quickly optimize campaigns across multiple channels for maximum impact.
- Structured ROI Frameworks: Use advanced tools and methods like the Data ROI Pyramid to track and calculate ROI effectively.
Key Steps:
- Define ROI Metrics: Use clear KPIs like customer lifetime value or churn rate.
- Apply Frameworks: Track ROI using formulas that include costs, benefits, and data downtime.
- Choose Tools: Leverage analytics platforms like Google Analytics 4, HubSpot, or Mixpanel for insights.
- Maximize ROI: Focus on high-impact projects, adopt AI, and build a data-driven culture.
Quick Tip: Businesses using structured data strategies are 3x more likely to improve ROI and 5x faster in decision-making. Start by defining clear goals, tracking results, and scaling successful strategies.
Step 1: Set Up ROI Metrics for Data Analytics
To make data-driven strategies work for your agency, you need a clear starting point: defining the exact ROI metrics that measure success. These metrics should align directly with your business goals, acting as a compass to guide your analytics efforts.
With global spending on big data analytics projected to hit $230.6 billion by 2025, it’s clear that understanding what you’re measuring – and why – isn’t just helpful. It’s essential.
Learn the ROI Formula
The formula for ROI is straightforward: Net Benefits ÷ Total Costs × 100. But the real work lies in breaking it down. Start by quantifying your benefits, such as increased revenue, reduced costs, or better customer retention. Then, account for every cost – both obvious and hidden.
- Obvious costs: Analytics software subscriptions, cloud storage, and hardware.
- Hidden costs: Employee time spent on data prep, training expenses, and even downtime during system rollouts.
Don’t overlook intangible benefits like faster decision-making, improved customer satisfaction, or a stronger competitive edge. While harder to quantify, these can deliver immense long-term value.
Choose Key Performance Indicators (KPIs)
The right KPIs keep your analytics efforts laser-focused on driving outcomes that matter. Start by identifying the specific use cases you want to target and the metrics that define success. The SMART framework – specific, measurable, achievable, relevant, and time-bound – is a reliable guide. For instance, instead of a vague goal like “better customer insights,” aim for something concrete, like achieving 95% accuracy in your customer segmentation model by the end of Q2.
Both marketing and sales teams benefit from a 360-degree view of the customer, though their priorities may differ. For example:
| Category | Sample KPIs |
|---|---|
| 360‑Degree View of the Customer | Net Promoter Score (NPS), Number of sales, Average deal size, Revenue by campaign, Churn rate, Customer lifetime value by segment, Acquisition and retention costs by segment |
When setting KPIs, ensure they’re directly tied to your business strategy. Chasing metrics that look impressive but don’t contribute to your bottom line is a waste of time and resources.
Here are a few practical KPI examples you can start using right away:
- Model accuracy: Achieve 95% accuracy for your customer segmentation model by the end of Q2.
- Data completeness: Reduce missing customer data fields to less than 1% within Q2.
- Time-to-insight: Deliver actionable insights from new customer data within 7 business days.
“We highlight the metrics that matter most to our leadership and prioritize them accordingly. For them, it’s not about the KPIs; it’s about what the KPIs mean. We share the stats, but we interpret what they mean for our executives.”
– Allison Wagner, Director of Marketing and Business Strategy, Morrison Container Handling Solutions
With these metrics in place, you’re ready to apply a structured framework to track and analyze ROI consistently.
Step 2: Use a Framework for Tracking ROI
Once you’ve nailed down your ROI metrics, the next step is to apply a structured framework. This helps you uncover the full value of your data initiatives. The standard ROI formula – Value Generated ÷ Investment – misses crucial elements like data downtime or the broader impact of your data team. That’s why a more refined approach is essential.
The Data ROI Pyramid Framework
The Data ROI Pyramid gives you a broader and sharper lens to evaluate your analytics investments. It introduces an updated formula:
(Data product value – Data downtime) ÷ Data investment = ROI.
This framework categorizes data products into three distinct groups:
- Analytical data products: These include dashboards, reports, and business intelligence tools that fuel better decision-making. Think of your weekly performance dashboards or quarterly trend reports.
- Operational data products: These focus on automation and streamlining processes. Examples include automated inventory systems, fraud detection algorithms, and predictive maintenance tools.
- Customer-facing data products: These impact the customer experience directly. Personalized recommendation engines, dynamic pricing models, or targeted marketing campaigns fall into this category.
Another critical factor in this framework is data downtime – those moments when your data is unavailable or inaccurate, costing you time and money. To calculate this, use:
Number of incidents × (average time to detection + average time to resolution).
“By better quantifying and optimizing the data team’s value, we can better earn our colleagues’ trust and recognition of the value we add to the business. At that point, the sky’s the limit for motivated, well-led data teams.”
- Barr Moses, Co-Founder & CEO, Monte Carlo
With this framework in place, you can tailor your ROI calculations to fit specific analytics scenarios.
Calculate ROI Across Different Use Cases
Not all analytics initiatives are created equal, and neither are their ROI measurements. Here are five proven methods to calculate ROI across various scenarios:
- Adoption-Based ROI: This measures the success of new analytics tools or features. For example, a property management software company rolled out new BI capabilities. After six months, they found the value per active user was $500, with 1,000 active users. With implementation costs of $200,000, their ROI hit 250%.
- Data-Driven Changes ROI: This evaluates the impact of specific optimizations. A property management client used BI tools to refine their pricing strategy, generating $150,000 in value. With $20,000 in implementation costs and $5,000 in analysis costs, their ROI soared to 2,600%.
- Customer Satisfaction ROI: This tracks how analytics improve client relationships. One company saw their Net Promoter Score rise from 40 to 55 after launching BI capabilities. With a customer base valued at $10,000,000 and analysis costs of $100,000, they achieved a jaw-dropping 13,750% ROI.
- Product Increment ROI: This measures the impact of new data-driven features. For instance, a company developed an occupancy rate forecasting tool for property managers, generating $300,000 in revenue. After deducting $100,000 in development costs and $20,000 in data analysis, they netted a 1,000% ROI.
- Data Maturity ROI: This gauges organization-wide improvements in data capabilities. If 200 employees each gained $2,000 worth of new data skills, and the total data team expense was $500,000, the result was an 80% ROI.
The secret is aligning the right calculation method with the specific use case. A customer retention project will demand different metrics than a process automation initiative. By choosing the right approach, you’ll not only gain accurate insights but also demonstrate the undeniable value of your data investments.
Step 3: Pick Tools and Technologies for ROI Measurement
Once your ROI framework is in place, the next move is selecting the tools that turn raw data into growth you can measure. The right analytics tools aren’t just helpful – they’re essential. Businesses using marketing analytics tools have reported a 54% revenue boost, and marketing teams can save 80–100 hours per week with automation.
What to Look for in Analytics Tools
Not all tools are created equal. Focus on features that directly improve your ability to track and optimize results. First, usability matters. Your team should be able to access, share, and analyze data without needing a tech wizard on standby.
Another must-have? Full customer journey tracking. The tool should capture every touchpoint – both online and offline – so you can see the entire path a customer takes, from their first website visit to their final purchase. This clarity helps you fine-tune campaigns and maintain consistent ROI growth.
Integration capabilities are also critical. Your analytics tool needs to play nice with the rest of your tech stack. Look for strong APIs and connectors that reduce manual work and create a unified view of your customer data across all channels.
Real-time data is non-negotiable. Waiting 24 hours for reports can leave you flying blind. A good tool should offer immediate access to performance metrics, including revenue-based analytics that spotlight the website elements driving the most revenue. Multi-touch attribution is another key feature, ensuring every marketing touchpoint gets the credit it deserves.
Lastly, transparent pricing is a must. Avoid tools that surprise you with hidden fees for integrations, extra usage, or additional accounts.
Analytics Software Options
The market is packed with tools for different needs and budgets. Here are a few options to consider:
- Google Analytics 4 (GA4): Free and powerful, GA4 uses an event-based data model to deliver detailed insights into customer behavior. It also integrates smoothly with advertising platforms, making it a great starting point for agencies new to analytics.
- HubSpot Marketing Hub: Starting at $20 per seat per month, HubSpot combines analytics with its CRM, offering a streamlined solution without the hassle of complex integrations.
- Ruler Analytics: Known for its revenue attribution capabilities, Ruler Analytics starts at about $250 per month (converted from £199). It integrates with nearly every tool in your stack and sends revenue-attributed data to platforms like BigQuery for deeper analysis.
- Mixpanel: Instead of focusing on page views, Mixpanel tracks user actions. For example, Lemonade used Mixpanel to identify a major drop-off point in their customer journey. Fixing this issue led to a 50% increase in additional coverage purchases. This tool is especially useful for SaaS and app-based businesses.
- Adobe Analytics: A heavyweight for enterprise-level needs, Adobe Analytics offers advanced features but comes with a hefty price tag – $2,000 to $2,500 per month for smaller setups, with enterprise solutions exceeding $100,000 annually. It’s complex but delivers unparalleled depth for large-scale operations.
- Domo: Designed for mid-market and enterprise clients, Domo consolidates data from multiple sources into easy-to-read dashboards. Pricing ranges from $20,000 to $75,000 annually for small and medium businesses, with enterprise plans starting at $50,000.
Real-World Results
Switching to better analytics tools can lead to game-changing results. For instance:
- Cooking Guild, an ecommerce brand, boosted revenue per session by 48% after switching from LuckyOrange to heatmapAI. They used revenue attribution insights to optimize their collections pages.
- Obvi, a health supplement company, added $2.5 million in revenue in just one month by moving from Microsoft Clarity to heatmapAI. They achieved a 4.69% increase in conversion rate and a 7.81% jump in revenue per session by improving CTA button placement.
The takeaway? Picking the right tool isn’t just about features. It’s about unlocking the insights that drive measurable growth. When your tools match your specific needs and integrate seamlessly with your systems, they become the backbone of a predictable ROI strategy.
What tools are you currently using, and are they giving you the clarity you need? Are you tracking the full customer journey, or are there blind spots? How much revenue could you unlock by upgrading your analytics game?
The right tool isn’t a cost – it’s an investment in clarity, control, and consistent growth.
Step 4: Methods to Maximize ROI from Big Data Analytics
To turn raw data into tangible growth strategies, you need more than just powerful analytics tools. The secret lies in prioritizing high-impact initiatives, leveraging advanced AI, and fostering a results-driven mindset across your organization. Companies that master these strategies often see ROI multiply by five to eight times.
Focus on High-Impact Projects
The best-performing agencies zero in on projects that address pressing business challenges and deliver measurable outcomes. It’s about aligning efforts with key priorities, setting clear goals, and involving stakeholders from different departments. Quick wins are a great way to build momentum for larger, more complex initiatives.
To filter out distractions, use a decision matrix to evaluate projects based on urgency and potential impact. This method cuts out guesswork and ensures energy is spent where it matters most. Adding advanced technologies to the mix can amplify these results even further.
Use AI and Machine Learning
AI turns analytics from a reactive tool into a proactive growth engine. Instead of spending time on repetitive tasks, data teams can focus on strategic insights that drive revenue.
Take PayPal, for example. In November 2023, they rolled out an AI-driven cybersecurity system that used deep learning to slash losses by 11%. Over three years, this approach nearly halved their loss rate, even as their payment volumes doubled. Their AI models, which can be deployed in just two to three weeks, also adapt quickly to emerging fraud patterns.
AI doesn’t stop there. It excels at spotting patterns across massive datasets – whether from CRM systems, ERP software, or even social media. This uncovers hidden links between marketing efforts and revenue streams. AI-powered dashboards provide real-time insights and allow for “what-if” scenario testing, making it easier to fine-tune strategies on the fly.
But even the best technology will fall flat without the right organizational mindset.
Build a Data-Driven Culture
Technology alone won’t deliver results. A true data-driven culture is essential, yet only 20% of executives feel they’ve achieved one, and just 27% are confident in turning data into actionable insights.
Leadership plays a critical role here. When DBS Bank began its digital transformation, CEO Piyush Gupta emphasized experimentation and learning from failure. This kind of leadership encourages teams to embrace innovation and take calculated risks.
Breaking down silos is equally important. Gulf Bank, for instance, launched a data ambassador program to connect employees with the value of data science through top-tier training and recognition. Similarly, JPMorgan Chase expanded its AWS DeepRacer program from local events to 20 global tech centers, producing seven of the 40 championship finalists in 2021.
Training should be timely and relevant. Instead of overwhelming teams with information, provide training just before they need to apply specific analytical tools or concepts. Celebrating wins also helps embed a data-driven ethos. For example, a cold chain logistics company implemented an AI scheduling system that cut turnaround times by 16% and saved $1.2 million annually. Leaders shared this success through newsletters, town halls, and video case studies, inspiring broader adoption.
Finally, set crystal-clear KPIs and objectives. Define the business outcomes you’re aiming for, how success will be measured, and the data required to calculate ROI. This clarity ensures analytics initiatives stay on track and deliver real results.
“A common trend we see across the financial vertical is financial institutions tend to be very siloed in their marketing approach with separate teams focusing individually on deposits, loans, etc. Working with CMOs to gather data across those silos into a full life-cycle view has enabled us to make smarter decisions about cross-sell and what might be the next best product to market to each individual client.”
– Katie Resch, VP Client Partner, Hero Digital
Building a data-driven culture takes time, but the rewards are worth it. Companies that embrace this mindset consistently achieve five to eight times the ROI of those relying on gut instincts and guesswork.
Conclusion: Achieve Predictable ROI Growth with Big Data Analytics
Big data analytics isn’t just about gathering numbers – it’s about turning those numbers into measurable returns. The four-step approach shared here gives you a straightforward plan to track and maximize ROI. But let’s be clear: success doesn’t happen by chance. It’s the result of disciplined, systematic action.
The stakes are high, and the rewards are undeniable. As global investments in big data analytics skyrocket, businesses prioritizing data-driven decisions are reaping the benefits. Companies using structured data strategies are 5 times more likely to make faster decisions and 3 times more likely to improve their ROI. Retailers leveraging big data analytics report ROI boosts of 15–20%, and for every dollar spent on big data projects, businesses aim to generate $3.50 in return.
These numbers tell the story: a disciplined, methodical approach is non-negotiable. Start with clear, measurable objectives. Account for all costs – from staffing to software. Quantify both the tangible returns and the harder-to-measure benefits. And above all, track progress consistently to ensure your initiatives stay aligned and deliver the results you expect.
This isn’t just theory – it’s a framework for sustainable growth. For agency owners striving for predictable expansion, this mirrors the approach championed by Predictable Profits. Their philosophy is simple yet powerful: systems over hustle, predictability over randomness. The same principles that drive their clients’ revenue growth apply here – replace guesswork with proven systems, and watch your data initiatives deliver consistent, scalable ROI.
The roadmap is clear. Start with one impactful project. Measure every step. Scale what works. Build a culture where decisions are driven by data, not gut feelings. Companies that master this approach don’t just grow – they create long-term competitive advantages that multiply over time.
What’s your next move? Which project has the potential to deliver the biggest impact? How will you measure success and scale it?
The data is waiting. The results are yours to claim.
FAQs
How can businesses choose the right KPIs to measure and improve ROI with big data analytics?
To get the most out of big data analytics and truly understand your ROI, you need to start with a clear game plan. Define your key objectives and tie them directly to specific, measurable KPIs. Think conversion rates, customer acquisition costs, or customer lifetime value – these are the metrics that tell you whether your marketing efforts are paying off.
But here’s the catch: KPIs aren’t set-it-and-forget-it. As your business evolves, so should your metrics. Regularly revisit and refine them to ensure they stay aligned with your goals. And don’t get lost in a sea of data. Focus on a handful of actionable KPIs – the ones that directly drive decisions. Too much data muddies the waters, leaving you overwhelmed instead of empowered.
When you keep your objectives sharp and your KPIs relevant, big data analytics becomes a powerful tool. It’s not just about tracking ROI – it’s about making smarter moves that push your business forward.
How can agency owners use AI and machine learning with big data analytics to boost ROI?
To weave AI and machine learning into your big data analytics framework and see real ROI growth, start with the basics: your data. It has to be clean, relevant, and well-organized. Why? Because messy or irrelevant data leads to flawed AI models and weak insights. High-quality data is the foundation for everything else.
Once your data is in shape, use predictive analytics to stay ahead of the curve. Predict trends, anticipate customer behaviors, and uncover market opportunities before your competitors do. This proactive approach lets you make smarter, faster decisions that align with your business goals.
But it doesn’t stop there. AI models need constant attention. Regularly monitor and fine-tune them to keep performance sharp and responsive to real-time changes in your data. The market moves fast – your AI has to move faster.
Lastly, build a data-driven culture across your team. Make sure everyone understands how to use AI-generated insights in their daily decisions. When your entire organization is aligned and acting on data, every move you make drives measurable ROI growth.
Are you leveraging your data to its full potential? How often are you refining your AI models? What’s stopping your team from fully embracing AI insights?
Here’s the truth: AI isn’t a magic wand – it’s a tool. But when used right, it turns data into dollars.
How can businesses create a data-driven culture to maximize the ROI of their big data analytics efforts?
To get the most out of big data analytics and build a culture that thrives on data, businesses need to focus on a handful of strategies that pack a punch.
First, leadership has to lead the charge. When decision-makers at the top prioritize data-driven choices, it sends a clear message to the entire organization: data isn’t just a tool – it’s the foundation.
Next, make data accessible to everyone who needs it. Breaking down silos and encouraging cross-department collaboration allows teams to work smarter, not harder. When employees have access to the right data, they can make informed decisions that align with broader company goals.
But access alone isn’t enough. Train your people. Equip your teams with the skills to read, analyze, and act on data. Without proper training, even the best data can go to waste.
Speaking of data, it’s only as good as its quality. High-quality data – accurate, complete, and reliable – is the backbone of every sound decision. Garbage in, garbage out, as they say.
Finally, don’t forget about the infrastructure. Scalable systems are non-negotiable. As your data grows, your systems need to grow with it – securely and efficiently.
These strategies aren’t just about crunching numbers; they’re about creating an environment where data drives smarter, faster, and more profitable decisions. That’s how you turn analytics into ROI.
Related Blog Posts
- How Personalization Boosts Retention in B2B
- Data-Driven Upselling in Loyalty Programs
- Ultimate Guide to CRM and Attribution Integration
- Evaluating Sales Team Performance: Metrics That Matter
The Predictable Profits Newsletter
Build a More Predictable Pipeline. Close More of the Right Deals.
Get practical lessons each week to help you generate more qualified leads, improve sales conversion, and create consistent growth without relying on heroics or luck.


